Understanding the Relationships View in Power BI and Using It to Join Tables
The Relationships View in Power BI is a vital tool for connecting and organizing datasets, enabling seamless data integration for dynamic reporting. This blog explores how to effectively use this feature to join tables, manage relationships, and optimize your data model. From understanding relationship types and cross-filter directions to leveraging best practices like star schemas and surrogate keys, you’ll gain the insights needed to create cohesive, error-free reports. Mastering the Relationships View empowers businesses to turn raw data into actionable insights, driving smarter, data-driven decisions.
POWER BI
The Relationships View in Power BI is a critical tool for organizing and connecting datasets in your model. Whether you're a beginner or an experienced user, mastering this feature can dramatically enhance your ability to create powerful and insightful reports. Let’s explore what the Relationships View is and how to use it to join tables effectively.
What Is the Relationships View?
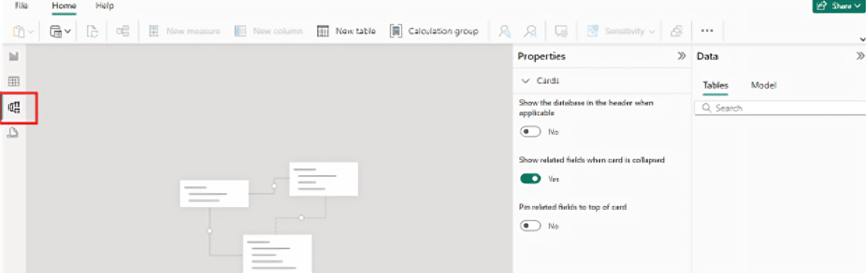
The Relationships View in Power BI is a graphical interface that displays the connections between the tables in your data model. It helps you:
· Visualize relationships between tables.
· Manage and edit connections.
· Ensure data flows correctly for analysis.
This view is essential for creating reports where data comes from multiple sources and needs to interact cohesively.
Why Relationships Are Important
Relationships define how tables in Power BI communicate with each other. They enable you to:
· Filter Data Across Tables: A relationship ensures that filters applied in one table propagate to related tables.
· Combine Data Seamlessly: Relationships join tables so that measures and calculations reflect a unified dataset.
· Improve Model Accuracy: Proper relationships reduce errors in calculations and visualizations.
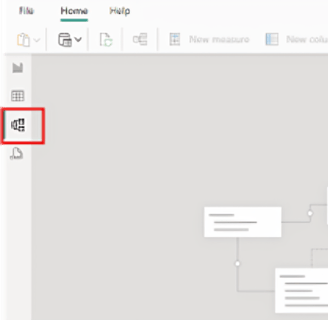
Step 1: Access the Relationships View
1. Open your Power BI Desktop file.
2. Navigate to the Model View by clicking the Model icon on the left pane (it looks like a network diagram).
3. You’ll see a visual representation of all tables in your model, with lines indicating relationships.
Step 2: Join Tables in the Relationships View
To join tables:
1. Drag and Drop Columns:
a. Click and drag a column from one table to the corresponding column in another table.
b. For example, drag a CustomerID column from a Customers table to the CustomerID column in an Orders table.
2. Define the Relationship Type:
a. Power BI will prompt you to confirm the relationship settings.
b. Specify the relationship type:
i. One-to-Many (1:*): Default for most data models.
ii. Many-to-Many (:): For complex scenarios with overlapping values.
iii. One-to-One (1:1): Rare but useful for certain cases.
3. Set Cross-Filter Direction:
a. Choose Single or Both depending on how filters should propagate between tables.
b. Use Both when filters need to affect both tables.
Step 3: Manage Relationships
1. Click on the Manage Relationships button in the Model ribbon.
2. Here, you can:
a. Edit relationships.
b. Delete incorrect connections.
c. Create new relationships manually.
3. Use the AutoDetect feature to let Power BI suggest relationships based on matching column names.
Step 4: Use Relationships in Your Reports
Once relationships are set up:
· Build visualizations that pull data from related tables. For instance, create a chart showing sales by customer name, even if names and sales are in separate tables.
· Use slicers and filters to dynamically drill down into your data.
Step 5: Test and Optimize Your Relationships
1. Test Relationships: Use a table visualization to confirm that data from related tables joins correctly.
2. Optimize Relationships:
a. Remove unnecessary relationships to improve performance.
b. Avoid many-to-many relationships unless absolutely necessary.
Best Practices for Using Relationships View
· Understand Your Data Model: Familiarize yourself with the structure and cardinality of your tables.
· Use Surrogate Keys: If tables don’t share natural keys, create surrogate keys to establish relationships.
· Leverage Star Schema: Arrange tables in a star schema with fact tables at the center and dimension tables branching out.
· Avoid Ambiguity: Ensure no two relationships create a loop in the model, as this can cause errors.
Why Relationships View Matters for Your Business
By mastering the Relationships View, you can transform raw data into actionable insights. This tool empowers you to build dynamic reports that uncover hidden patterns and drive smarter decision-making.
Need help setting up your Power BI model? Contact [Your Consultancy Name] today. Let us guide you toward better, faster insights with Power BI.
Start connecting your data like a pro!
Do you need help with your data? Contact us to schedule a consultation and take the first step toward unlocking your data's potential!
Insighthuis, building success with data-driven decisions.
Maastricht, Netherlands
Call us: +31 (6) 49158701 / +31 (6)85450973
Contact us: info@insighthuis.com