How to Connect Power BI to an Excel File with Multiple Sheets
Discover how to connect Power BI to an Excel file with multiple sheets and consolidate your data seamlessly. This blog guides you through importing and transforming data from various sheets into a unified dataset. Learn efficient techniques to manage structured data, automate updates, and create dynamic reports for better insights.
POWER BI
Unlock the Power of Your Data: Connecting Power BI to an Excel File with Multiple Sheets
As a small or medium-sized business, you rely on insightful data analysis to drive decisions. Power BI offers a powerful way to visualize your data, and it integrates seamlessly with Excel—a tool you likely already use daily. If you're wondering how to connect Power BI to an Excel file with multiple sheets, this guide is for you. Let’s walk through this process step by step.
Step 1: Prepare Your Excel File
Before connecting to Power BI, ensure your Excel file is clean and organized:
· Name Your Sheets Clearly: Use descriptive names for each sheet. This will make it easier to identify them in Power BI.
· Format Your Data as Tables: In Excel, highlight your data, go to the Insert tab, and click Table. This ensures Power BI can easily recognize your data structure.
· Remove Blank Rows/Columns: Clean data is essential for smooth integration.
Step 2: Open Power BI Desktop
1. Download Power BI Desktop (if you haven’t already) from the Power BI website.
2. Launch Power BI Desktop and open a new file.
Step 3: Connect to the Excel File
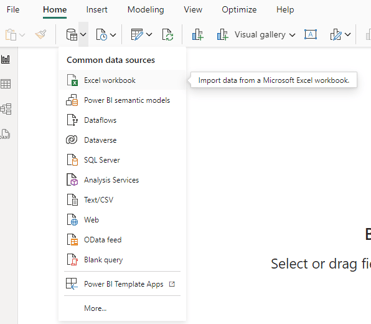
1. Click on “Get Data” from the Home ribbon.
2. Select Excel Workbook and browse to your Excel file.
3. Click Open to establish the connection.
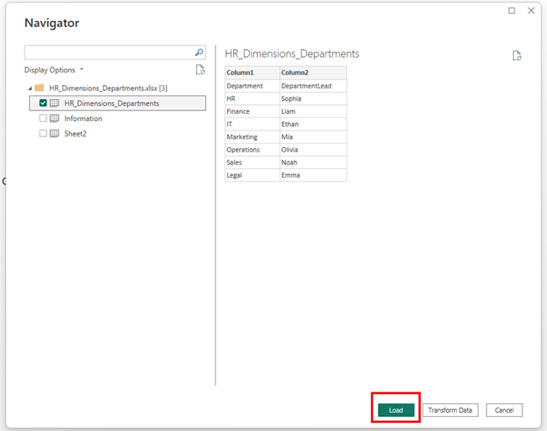
Step 4: Select Sheets or Tables
Once the connection is established:
· A navigator window will display all the sheets and tables in your Excel file.
· Select the sheets you want to include in your Power BI report.
· Preview the data to confirm it’s loading correctly.
Step 5: Transform Data (Optional)
The Power Query Editor will open, allowing you to transform your data:
· Combine Data from Multiple Sheets: If you have consistent data across sheets (e.g., monthly sales reports), use the Append Queries option.
· Clean Data: Remove duplicates, filter rows, or split columns if necessary.
· Click Close & Apply to load the transformed data into Power BI.
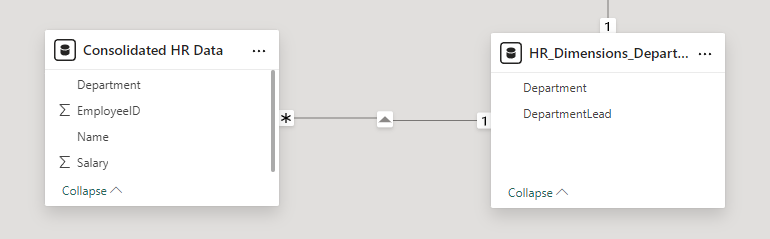
Step 6: Create Relationships Between Sheets
If your sheets are related (e.g., a product list and sales transactions), establish relationships between them:
1. Go to the Model View in Power BI.
2. Drag and drop fields to create relationships between tables.
3. Ensure the relationships are correct (e.g., one-to-many).
Step 7: Build Your Visualizations
Now that your data is ready, it’s time to create impactful visuals:
· Use charts, tables, and KPIs to represent key metrics.
· Add slicers to allow filtering by criteria like date, product, or region.
· Create a dashboard to give an overview of your business performance.
Step 8: Save and Publish
1. Save your Power BI file (*.pbix) locally.
2. If you use Power BI Service, publish the report to share with your team.
Why This Matters for Your Business
By connecting Power BI to an Excel file with multiple sheets, you unlock a unified view of your data, enabling better analysis and decision-making. This integration is a game-changer for businesses seeking to grow without investing in overly complex systems.
For personalized guidance or to discuss how Power BI can transform your business, contact us at Insighthuis.com.
Let’s make your data work for you!
Insighthuis, building success with data-driven decisions.
Maastricht, Netherlands
Call us: +31 (6) 49158701 / +31 (6)85450973
Contact us: info@insighthuis.com